Wind-Ice Interaction Viewed by QuikSCAT
W. Timothy Liu, NASA Jet Propulsion Laboratory
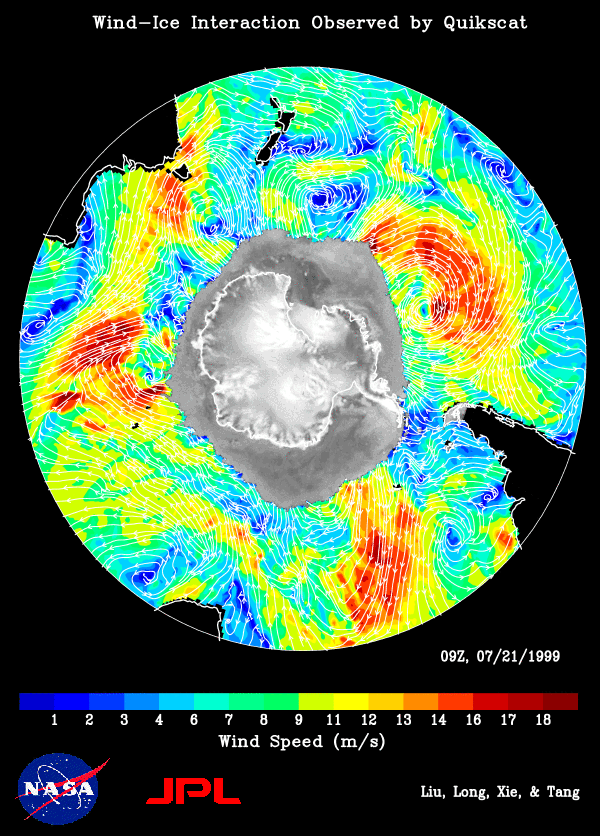
SeaWinds on NASA mission QuikSCAT reveals three groups of intense storms surrounding Antarctica and they are associated with three maxima of sea ice extent (SIE). The Quikscat observations support the postulation of Yuan, Liu, and Martinson [JGR, 104,1991-2007,1999] on the positive feedback between wind pattern and the SIE maxima, and the SIE maxima provide favorable conditions for cyclogenesis in the open ocean. The improved coverage of Quikscat makes observation of high frequency interaction possible.
 The figure demonstrates of the capability of QuikSCAt in monitoring
both sea-ice and ocean surface wind, thus helping to further
our knowledge in wind-ice interaction and its effect on climate change.
The gray-scale image of normalized radar backscatter shows
various kinds of ice in Antarctica. The landmass is outlined in
black. The gray area outside the landmass is occupied by sea ice. Outside
of the ice, white streamlines representing wind direction are overlaid onto
the color image of wind speed distribution. The map (including
both ice and wind) is produced from one day, 21 July 1999, of
QuikSCAT interim observations.
With its all-weather observing capability, QuikSCAT provides continuous monitoring of ice edge, tracking of iceberg, and describes the morphology of both glacier-ice and sea-ice. Since the start of its ocean observing mode, QuikSCAT has already helped the National Snow and Ice Data Center in tracking an iceberg broken off from Antarctica.
The figure is from a peer-review book chapter: Liu, W.T. and W. Tang, 2000: Dynamic link between the ocean and the atmosphere. Ocean-Atmosphere Remote Sensing, X. Yan and H. Lin (eds), Hong Kong Chinese Univ. Press, Section III, 1-8.
The normalized backscatter data over Antarctica were provided by David Long. Xiaosu Xie produced the graphics.